Using ggmap after July 2018
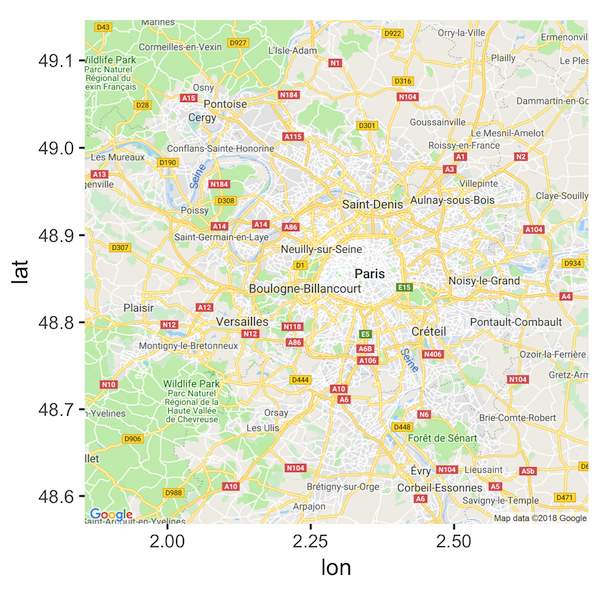
ggmap is an awesome package for creating maps with ggplot2. If you’ve seen a nice looking map built with ggplot2 I can almost guarantee you that it uses ggmap to look that good. The ggmap package is …
ggmap is an awesome package for creating maps with ggplot2. If you’ve seen a nice looking map built with ggplot2 I can almost guarantee you that it uses ggmap to look that good. The ggmap package is …
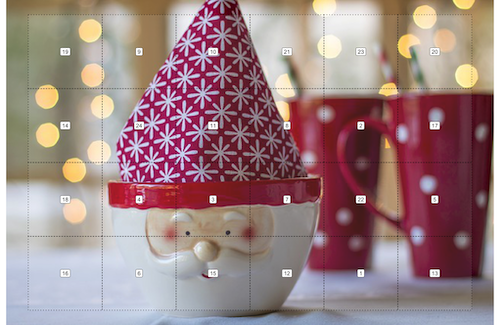
There are just about 24 Christmassy hot drinks available in the big UK cafes. I’ve made an advent calendae of them in ggplot2, read this post to find out how to do the same.
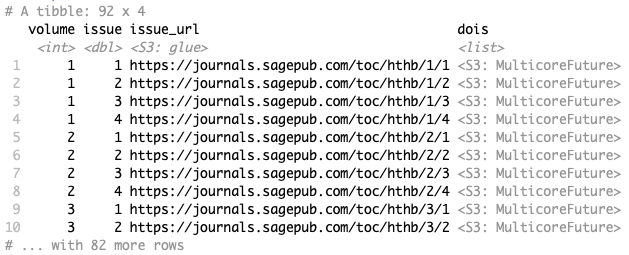
Academic literature reviews are more than often tedious tasks, manually clicking through a journal’s history of volumes and journals. But, not it you programmatically crawl the website with {rvest} and friends.

Great circles are the shortest journeys between two points on a map, which can be easily computed and manipulated through the use of the excellent sf library, and visualised interactively with leaflet.
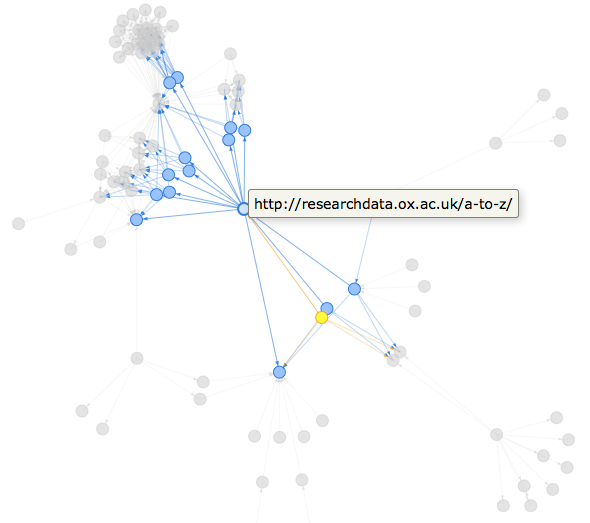
In this blogpost I use crawling the internal links between pages in the University of Oxford’s Research Data website as an excuse for finally getting to grips with tidygraph and ggraph
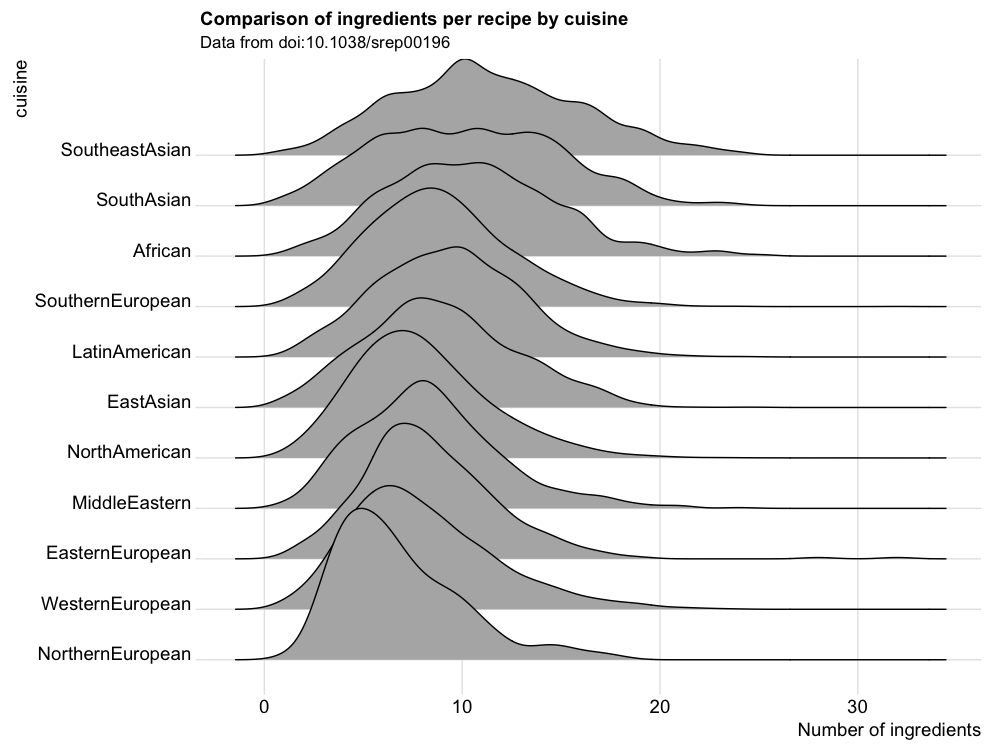
In this blogpost I introduce one of my favourite datasets, a treasure trove of 57,000+ recipes scraped from recipe websites for a fascinating research paper (DOI: 10.1038/srep00196) comparing how different cuisines choose ingredients. I first used this dataset in May 2015 to learn how to use R and continue to use it to test my understanding of new techniques and analysis.
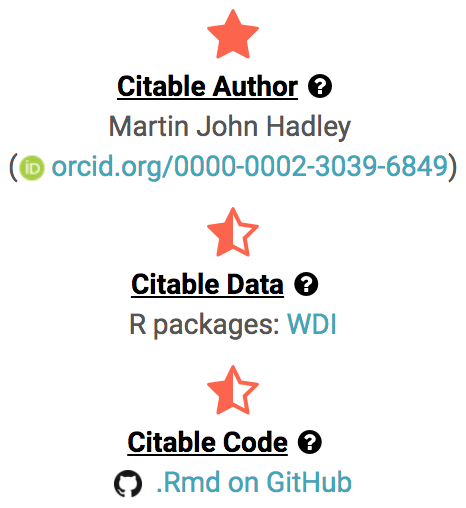
In this blogpost I introduce a rating system for the reproducibility of blogposts, taking authorship, data and code all into account. All blogposts include a star rating at both the top and bottom of the post with a link to (at least) the .Rmd file responsible for generating the page.
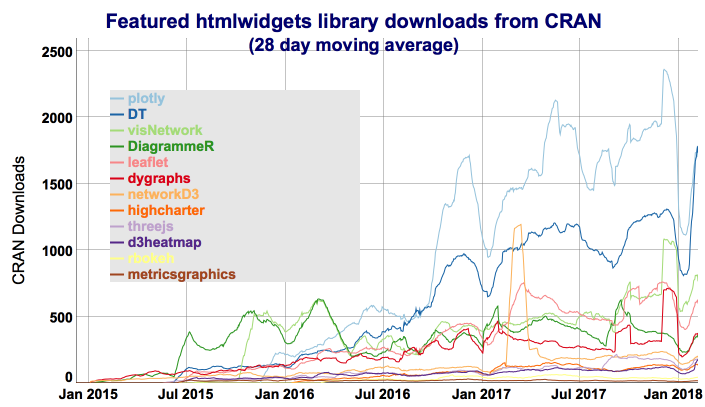
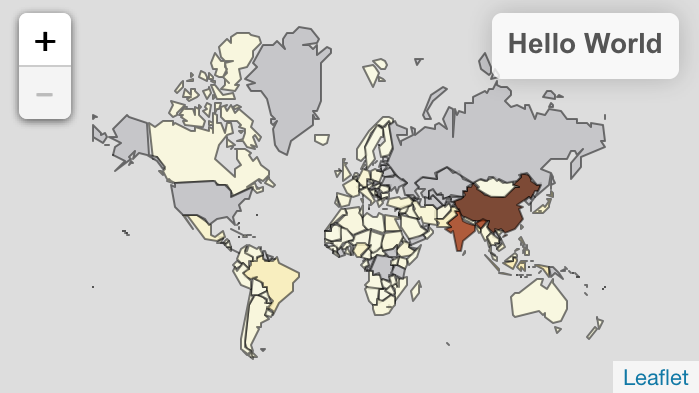
If you’ve never heard of them, htmlwidgets are an amazing part of the work that RStudio (plus ramnathv and timelyportfolio) have undertaken to make R a beautiful tool for doing data science and communicating things about your data. Using leaflet, plotly, highcharter and more it’s possible to create rich interactive charts, maps and other visualisations directly from R without having to learn JavaScript
After a long time coming, I’ve finally got round to picking a workable solution for creating my data blog “Visible Data”. This is a short overview of how I picked my tools and my intentions for the website.
Copyright (c) 2016 - 2020, Visible Data Ltd; all rights reserved.
Template by Bootstrapious. Ported to Hugo by DevCows